Indice
Workflow
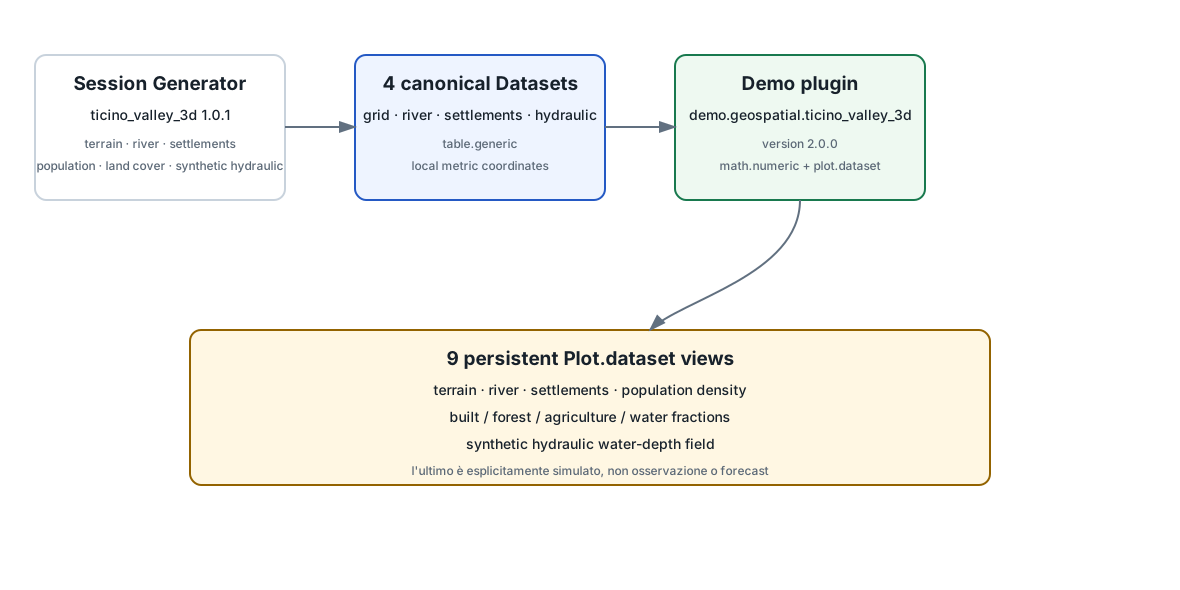
Il plugin demo.geospatial.ticino_valley_3d 2.0.0 combina dati geografici offline della valle del Ticino con un piccolo campo idraulico sintetico. Le sorgenti comprendono Copernicus GLO-30, un tracciato ordinato del Ticino derivato da RIRU, località e popolazione ISTAT e classi CORINE 2018. Le coordinate di lavoro sono offset metrici locali nel sistema EPSG:25832.
1. Terreno
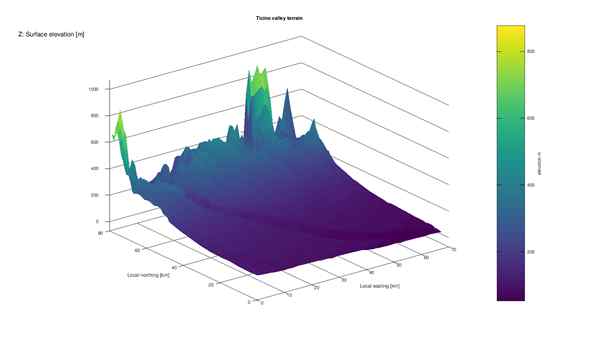
La geometria verticale e la scala colore sono entrambe legate alla quota. Il Dataset rettangolare viene reso come superficie 3D mantenendo coordinate, unità e identità delle variabili.
2. Ticino river centerline
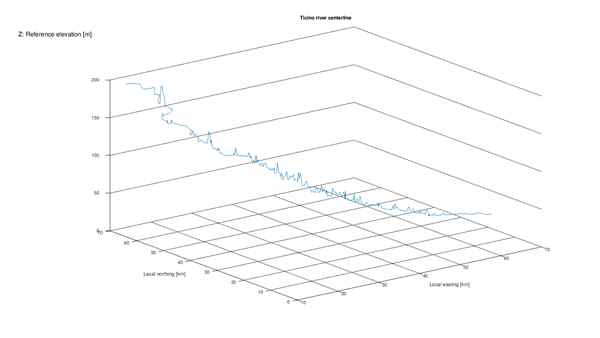
Il renderer segue una sequenza ordinata di punti invece di una griglia. La stessa infrastruttura 3D gestisce quindi superfici e traiettorie senza renderer privati separati.
3. Insediamenti
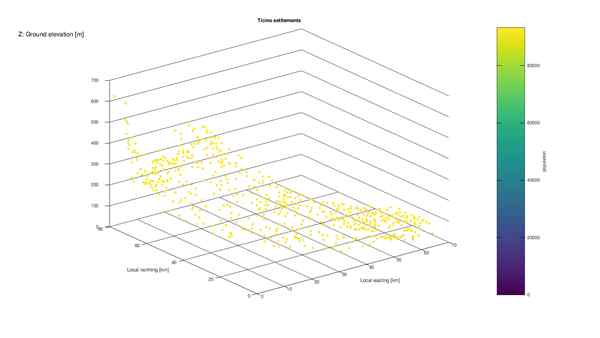
X/Y descrivono la posizione, Z la quota e il colore una quarta variabile indipendente.
4. Densità di popolazione
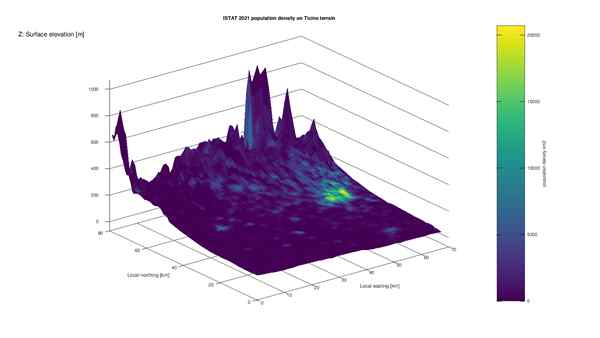
La geometria della superficie e la variabile di colore sono indipendenti. La griglia di popolazione del demo è una allocazione area-weighted derivata da celle sorgente ISTAT 2021, non un totale amministrativo ufficiale.
5–8. Land cover
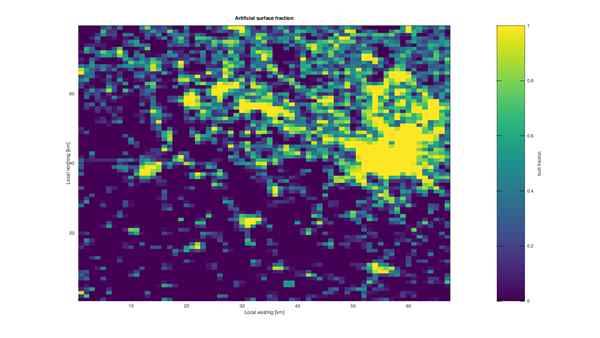
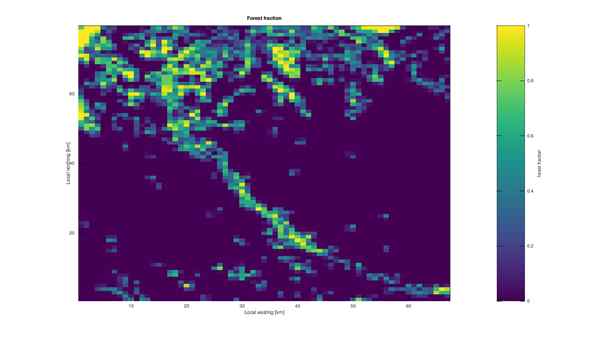
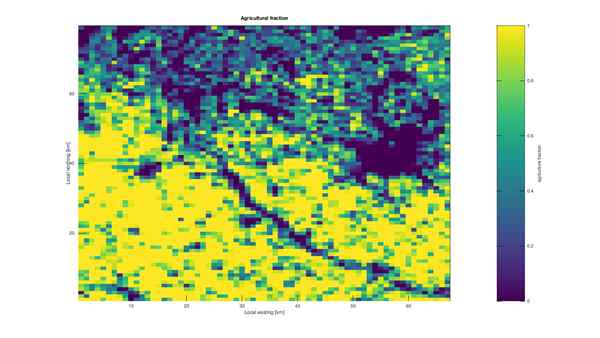
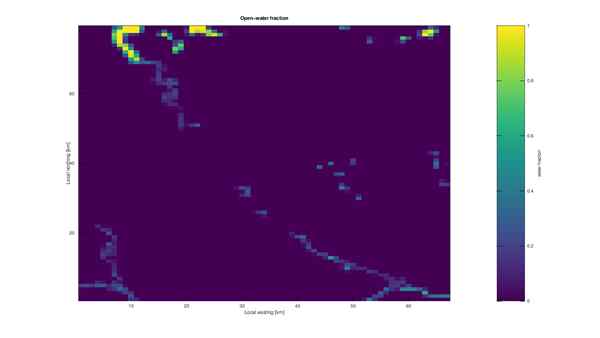
I quattro layer usano la stessa area e scala 0–1. Derivano da CORINE 2018; wetlands e classi naturali shrub/grassland non vengono riclassificate silenziosamente come acqua o foresta.
9. Campo idraulico sintetico
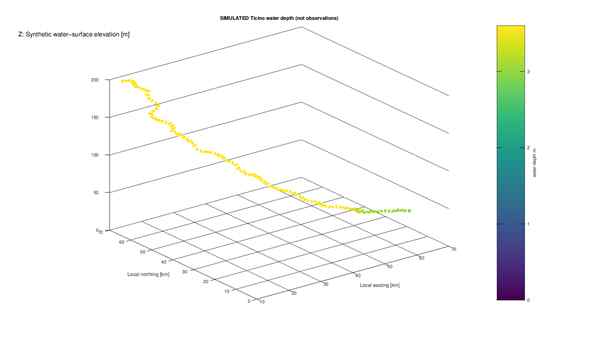
Il campo è sintetico e deterministico. Non è una misura, una portata osservata, una previsione, un flood model o un prodotto di sicurezza.
Persistenza e provenance
Ogni immagine è anche il render della corrispondente Plot.dataset Variant persistente. La Session conserva inoltre fonti, trasformazioni, classificazioni, attribution e SHA-256 del source bundle nella directory reference/.
- Copernicus GLO-30 per il digital surface model;
- RIRU per il percorso ordinato del Ticino;
- ISTAT per località e popolazione;
- CORINE Land Cover 2018 per le frazioni tematiche;
- campo idraulico sintetico generato per la dimostrazione.
Manuale tecnico completo del plugin
Ticino Valley 3D Cartography Demo
Input preparation
- Import
gxtxt_geospatial_examples_1.0.0.zipas an external Session Generator Library (or use the identical standaloneticino_valley_3d_session_generator_1.0.0.zipwithin that library). GenerateTicino Valley 3D Cartography. - In the generated Session, import these CSVs as
table.genericDatasets, with the exact IDs:
| Analysis Source | Dataset ID | Generated CSV |
|---|---|---|
primary |
ticino_valley_grid |
raw/ticino_valley_grid.csv |
river |
ticino_river_centerline |
raw/ticino_river_centerline.csv |
settlements |
ticino_valley_settlements |
raw/ticino_valley_settlements.csv |
hydraulic |
ticino_hydraulic_demo |
raw/ticino_hydraulic_demo.csv |
- Import the matching portable Dataset Metadata files from
metadata/if desired. This plugin does not require those metadata files to run, but preserving them improves interpretation and provenance. - Install the version 2.0.0 plugin with GX-TXT’s Plugin Install API, enable the module, select all four Analysis Sources, and run the analysis. The plugin does not import raw CSVs automatically or bypass canonical Dataset registration. It resolves the expected canonical column names to the Dataset’s stable variable IDs at runtime; keep those column names when importing.
Outputs and interpretation
ticino_valley_report.txt,ticino_valley_metrics.ini: actual source-derived summaries. The population grid values are area-weighted allocations from ISTAT source cells, not an official administrative population total.01_ticino_terrain_3d.png: Copernicus GLO-30 digital surface model (DSM).02_ticino_river_3d.png: RIRU-derived ordered Ticino route, using its source elevation.03_ticino_settlements_3d.png: ISTAT localities at ground elevation, colored by population.04_ticino_population_3d.png: terrain colored by allocated population density in people/km².05_ticino_built_fraction.pngthrough08_ticino_water_fraction.png: separate 0–1 fraction maps from CORINE 2018 artificial, forest, agriculture and open-water classes. Wetlands and natural shrub/grassland are not silently assigned to water or forest.09_ticino_synthetic_hydraulic_3d.png: the generator’s deterministic, synthetic water-depth field. It is not an observation, measured discharge, forecast, flood model or safety product.
All nine plots use persistent public Plot.dataset variants, including the framework’s axis, color, export and rerender controls. Numeric elevation remains in original metres in reports and on the plotted Z axes. Coordinates on the plot axes are local kilometre offsets within EPSG:25832; metric geometry is never calculated in latitude/longitude degrees.
The module validates grid shape, 1 km spacing, finite values,
population and fraction ranges, increasing river chainage and the
synthetic water_surface = bed + depth identity. Four source
Datasets are mandatory, and mismatched Dataset IDs are rejected to avoid
accidentally labelling unrelated hydraulic data as synthetic.
Provenance and rights
The Session Generator’s reference/ directory records the
exact public sources, transformations, classification, attributions and
source-bundle SHA-256. The underlying clipped source bundle is
ticino_valley_source_bundle_20260923.tgz. This plugin
contains executable plotting/analysis code only. Source-data license and
attribution obligations remain those documented in the generated
Session; no endorsement by source organizations is implied.
Re-rendering
Presentation-only re-rendering uses GX-TXT Render Cache API v1. A changed source fingerprint invalidates the cache; run analysis again instead of reusing stale images.