Indice
Tipo di demo
| Plugin | demo.environmental.levoglucosan_campaign 1.2.2 |
|---|---|
| Generator | sardinia_levoglucosan_campaign 1.1.1 |
| Categoria | Environmental Chemistry |
1. Cosa simula
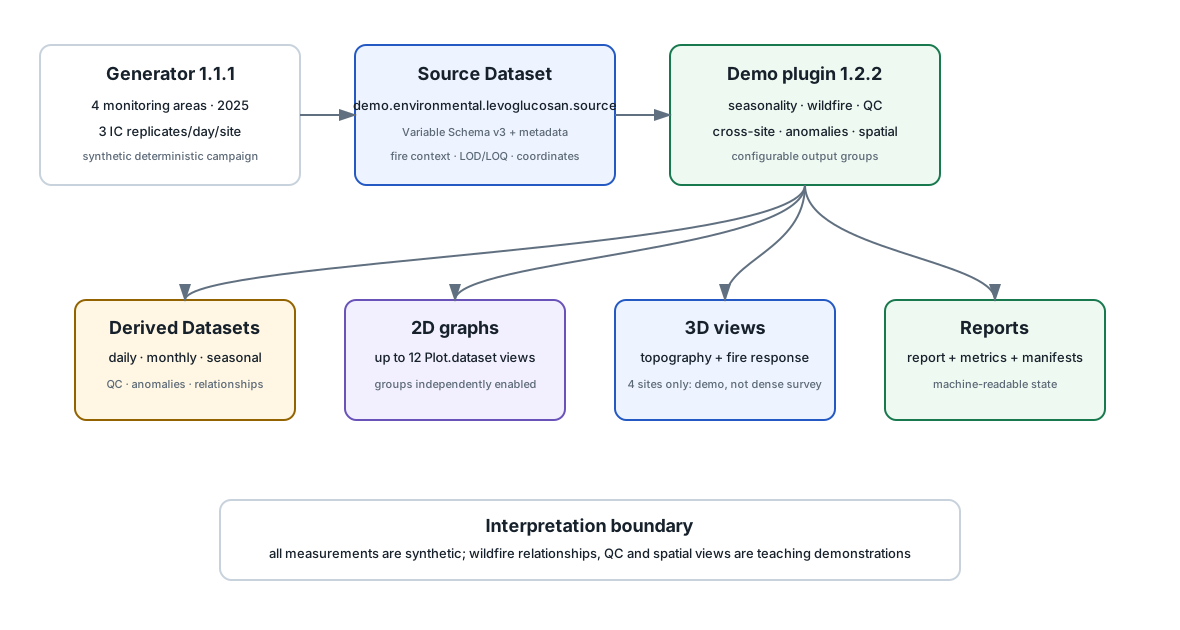
Una campagna annuale sintetica e deterministica in Sardegna con quattro aree di monitoraggio, triplicati tecnici IC, background stagionale da biomass burning, episodi estivi di wildfire, LOD/LOQ e incertezza analitica.
2. Gruppi configurabili
- campaign summary;
- seasonality;
- wildfire events and relationships;
- measurement uncertainty and QC;
- cross-site relationships;
- anomaly detection;
- spatial analysis;
- rendering 2D e 3D indipendenti.
3. Parametri didattici
| QC CV threshold | 10% |
|---|---|
| Anomaly moving-median window | 21 days |
| Positive anomaly z threshold | 4 |
| Cross-site max lag | 2 days |
4. Derived Datasets
La suite pubblica Dataset daily, monthly, seasonal, site summary, relationships, cross-site lag, fire relationships/regressions, uncertainty/QC e anomalies.
5. Grafici
Il demo può produrre fino a dodici viste 2D Plot.dataset e due viste 3D. Le viste spaziali con soli quattro siti sono esplicitamente dimostrative: una triangolazione grafica non equivale a una mappa continua di concentrazione.
6. Limiti di interpretazione
Manuale tecnico completo del plugin
Sardinia Levoglucosan Campaign Demo — User and Scientific Manual
Plugin:
demo.environmental.levoglucosan_campaign
Plugin version: 1.2.1
Bundled Session Generator:
sardinia_levoglucosan_campaign
Generator version: 1.1.1
GX-TXT: 0.9.7.77 or later
License: GNU GPL v3 or later
1. Purpose
This external GX-TXT demonstration analyzes a deterministic synthetic one-year atmospheric levoglucosan campaign in Sardinia, Italy.
The scientific scenario combines:
daily PM aerosol sampling
+
aqueous filter extraction
+
ion chromatography / HPAEC-PAD determination
+
levoglucosan as a biomass-burning marker
+
four Sardinian reference areas
+
three technical IC replicates per daily sample
+
winter residential biomass-burning signal
+
low ordinary summer background
+
episodic summer wildfire signals
+
measurement uncertainty
+
temporal, analytical and geographical comparisons
All campaign measurements generated by this package are synthetic. They are not observations from a real monitoring campaign. The generated Dataset Metadata records:
data.synthetic=trueThe literature described later in this manual is used only to choose scientifically plausible orders of magnitude and behavior.
2. Ready-to-run workflow
The normal demonstration does not require manual CSV import, Dataset Metadata import, Variable Schema editing, or variable binding.
Use this workflow:
install plugin
→ import bundled Session Generator
→ generate Session
→ open generated Session
→ Analysis
→ select Sardinia Levoglucosan Campaign Demo
→ optionally enable/disable output groups
→ Run
The ready-to-run contract is intentional:
Ready-to-run canonical Dataset
Dataset Metadata is already persisted
Analysis Source and bindings are already configured
All generated campaign measurements are synthetic.
The generated Session already contains:
- the registered canonical source Dataset;
- Variable Schema v3;
- scientific units and semantic roles;
- Dataset Metadata;
- the primary Analysis Source;
- stable module bindings;
- the module selection required by the demonstration.
New generator 1.1.1 Sessions explicitly bind elevation. Sessions
created by generator 1.1.0 remain usable because plugin 1.2.0 can
resolve the stable elevation_m variable as a compatibility
fallback.
3. Session Generator installation
The plugin package contains:
session_generators/sardinia_levoglucosan_campaign.zipThe same generator is also distributed as a standalone package.
Import it through the normal GX-TXT Session Generator Library Manager.
Identity:
Library:   GX-TXT Numerical Examples
Category:  Environmental Chemistry
Generator: Sardinia Levoglucosan Campaign
ID:        sardinia_levoglucosan_campaign
Version:   1.1.1
Generate a new Session using the normal generator command. The suggested Session name is:
sardinia-levoglucosan-campaign-20254. Generated campaign
The synthetic campaign uses calendar year 2025 as a deterministic non-leap-year model:
365 days
×
4 monitoring sites
×
3 technical IC replicates
=
4380 analytical rows
The year is part of the model. It does not imply that the synthetic measurements actually occurred in 2025.
4.1 Monitoring reference areas
The four synthetic monitoring reference locations represent distinct Sardinian settings:
- Cagliari metropolitan / coastal area — urban coastal;
- Gonnostramatza / Marmilla — rural inland;
- Nuoro / Barbagia — mountain inland;
- Olbia / Gallura — north-eastern coastal.
The Dataset carries site ID, name, zone, WGS84 latitude/longitude, elevation and environment class. These are reference locations for the synthetic demonstration, not claims about official monitoring stations.
4.2 Generator files
The generated Session includes at least:
raw/sardinia_levoglucosan_ic.csv
raw/sites.csv
raw/fire_events.csv

datasets/demo.environmental.levoglucosan.source.csv

metadata/datasets.ini
metadata/datasets/demo.environmental.levoglucosan.source.ini
metadata/manifest.ini
metadata/campaign.metadata.txt

reference/synthetic_truth.csv
raw/sardinia_levoglucosan_ic.csv is human-readable
source material. The registered canonical Dataset under
datasets/ is the source used by the ready-to-run Analysis
Source.
reference/synthetic_truth.csv exists only for
generator/test validation. The normal analysis plugin never reads
it.
5. Primary measurement and units
The primary analytical quantity is:
levoglucosan_ppmIt represents levoglucosan concentration in the simulated aqueous filter extract.
For this dilute aqueous demonstration:
1 ppm ≈ 1 mg/L = 1 µg/mLThe Dataset also carries the separately derived ambient concentration:
levoglucosan_ng_m3The two quantities are never treated as the same unit.
The synthetic method also records sampled air volume and extract volume so the conversion is reproducible.
6. Analytical replicates, LOD and LOQ
Each daily site sample has exactly three technical IC replicates.
Replicate noise contains:
relative analytical variation
+
small absolute noise floor
The absolute component prevents unrealistically zero uncertainty at low concentration.
The synthetic analytical thresholds are:
LOD = 0.010 ppm
LOQ = 0.030 ppm
Below-limit values are not silently replaced with zero. The source Dataset carries explicit below-LOD/below-LOQ information.
For a daily triplicate, the plugin calculates:
- arithmetic mean;
- replicate standard deviation (SD);
- standard error of the mean (SEM);
- two-sided 95% confidence interval using Student’s t for
n=3.
These quantities are intentionally kept distinct. Replicate SD measures technical analytical dispersion, while between-day variability is an environmental/time-series quantity.
7. Synthetic seasonal model
The latent campaign model combines:
site baseline
+
seasonal residential biomass-burning component
+
regional temporal variation
+
wildfire contribution
+
small environmental variability
The important seasonal behavior is:
winter
→ elevated biomass-burning background

spring
→ decreasing background

summer without fires
→ low background

summer wildfire episodes
→ strong local/regional spikes

autumn
→ gradual return of residential biomass-burning contribution
This intentionally avoids the scientifically misleading
simplification summer = always high levoglucosan.
8. Synthetic wildfire model
Several deterministic synthetic summer fire events are generated.
Each event has:
- event ID;
- start/end date;
- centroid latitude/longitude;
- severity index;
- synthetic burned-area scale.
The wildfire contribution depends on event severity, monitoring-site distance and temporal event evolution. A nearby site can therefore show a large response while distant sites show a smaller transported response.
The Central-West event is inspired only in broad scale and timing by the historical Montiferru fire. The generated 2025 event itself is synthetic.
9. Module input bindings
The module uses the public Analysis Source Map and stable Dataset variable identities.
Bindings are:
day_of_year
month
site_id
replicate_id
levoglucosan
fire_event_id
fire_exposure
fire_distance
latitude
longitude
elevation
below_lod
below_loq
New Sessions produced by generator 1.1.1 bind all of these automatically.
The principal source schema uses framework-compatible semantic roles such as:
independent
group
coordinate
concentration
generic
Scientific meaning is additionally preserved by stable variable IDs, units, metadata and the explicit module binding contract.
10. Configurable output groups
Version 1.2.0 is one configurable module. Separate specialized plugins are not required.
All groups are enabled by default.
10.1 Campaign summary
output_campaign_summary = true|falseProduces the compact campaign/site overview and annual summary presentation.
10.2 Seasonality
output_seasonality = true|falseControls annual, monthly and seasonal presentation.
10.3 Wildfire analysis
output_fire_events = true|falseControls selected-event plots and fire-exposure/distance relationships.
10.4 Measurement uncertainty / QC
output_uncertainty_qc = true|falseControls uncertainty-teaching output and analytical-QC presentation.
10.5 Cross-site relationships
output_cross_site = true|falseControls synchronized site correlations and lag-comparison presentation.
10.6 Anomaly detection
output_anomaly_detection = true|falseControls robust anomaly output based on a moving-median baseline.
10.7 Spatial analysis
output_spatial_analysis = true|falseControls geographical interpretation and enables the 3D spatial group when 3D rendering is also enabled.
10.8 Rendering switches
render_2d_graphs = true|false
render_3d_graphs = true|false
These are independent. For example, it is valid to run the numerical analysis and text report with all rendering disabled.
This is useful when testing the numerical pipeline separately from the more expensive plotting path.
11. Configurable analytical parameters
11.1 Technical-replicate CV threshold
qc_cv_threshold_percent = 10A daily triplicate with CV above this configurable threshold is flagged for the demonstration QC view.
This threshold is a teaching/demo criterion. It is not presented as a universal analytical-method acceptance requirement.
11.2 Anomaly baseline window
anomaly_window_days = 21Must be an odd integer >= 3.
A moving median is calculated through the public numerical service and used as a robust local baseline.
11.3 Positive anomaly threshold
anomaly_z_threshold = 4Residuals are scaled using a MAD-based robust scale:
robust scale = 1.4826 × MADPositive scores at or above the configured threshold are flagged.
This is descriptive anomaly detection, not automatic source apportionment.
11.4 Cross-site lag range
cross_site_max_lag_days = 2The plugin evaluates pairwise site relationships over signed lags
from -N to +N days.
12. Scientific analyses
The plugin transforms replicate-level measurements into reusable canonical derived Datasets.
12.1 Daily statistics
One row per day + site, including:
- mean concentration;
- replicate SD;
- SEM;
- Student-t 95% CI;
- fire context;
- below-LOD / below-LOQ counts.
12.2 Monthly statistics
One row per month + site, calculated from daily site means. Between-day SD is kept distinct from analytical replicate SD.
12.3 Seasonal statistics
Five categories are used:
1 winter
2 spring
3 summer non-fire
4 summer fire
5 autumn
12.4 Site summary
One row per site, including:
- latitude/longitude/elevation;
- annual mean and annual CI;
- winter mean;
- spring mean;
- summer non-fire mean;
- summer wildfire-period mean;
- autumn mean;
- wildfire enhancement factor;
- below-limit counts.
12.5 Fire relationships
The module evaluates:
- levoglucosan vs fire exposure index;
- levoglucosan vs active-fire distance;
- fire-day vs ordinary summer behavior.
Weighted linear regressions use inverse-variance weights based on daily SEM where appropriate.
Correlation/regression in the synthetic observations is reported as a relationship, not as an independent causal proof.
12.6 Cross-site relationships
For each of the six site pairs the module reports synchronized same-day correlation and sample count.
It also evaluates short signed lags over the configured range. This helps demonstrate shared regional events versus locally timed responses.
12.7 Measurement QC
For every daily triplicate the plugin calculates CV% and flags:
- high-CV triplicates according to the configured threshold;
- any measurement below LOD;
- any measurement below LOQ.
12.8 Robust anomaly detection
For each site:
daily mean
→ moving-median baseline
→ residual
→ MAD-based robust score
→ positive anomaly flag
The resulting Dataset also preserves fire event ID and fire exposure index so the user can inspect overlap between detected anomalies and known synthetic fire context without reading hidden synthetic truth.
13. Canonical derived Datasets
The main reusable publications include:
demo.environmental.levoglucosan.daily
demo.environmental.levoglucosan.monthly
demo.environmental.levoglucosan.seasonal
demo.environmental.levoglucosan.site_summary
demo.environmental.levoglucosan.relationships
demo.environmental.levoglucosan.cross_site_lag
demo.environmental.levoglucosan.fire_relationships
demo.environmental.levoglucosan.fire_exposure_regression
demo.environmental.levoglucosan.fire_distance_regression
demo.environmental.levoglucosan.uncertainty_demo
demo.environmental.levoglucosan.qc_daily
demo.environmental.levoglucosan.anomalies
Additional small per-site Datasets are published specifically for plotting. These use simple explicit X coordinates and avoid wide graph-only tables.
Derived scientific Datasets are republished on every successful analysis run even when a presentation group is disabled. Output switches control reporting and rendering, not scientific state freshness.
14. Automatic 2D graphs
2D graphs are created through public
PLOT_DATASET_API_v2. They are persistent
plot.dataset variants and can be rerendered through the
normal GX-TXT mechanism.
Up to twelve graphs are produced, depending on the selected groups.
14.1 Seasonality group
-
01_full_year_daily.png
Four-site daily mean time series over days 1..365. One confidence band demonstrates uncertainty without rendering hundreds of individual error bars.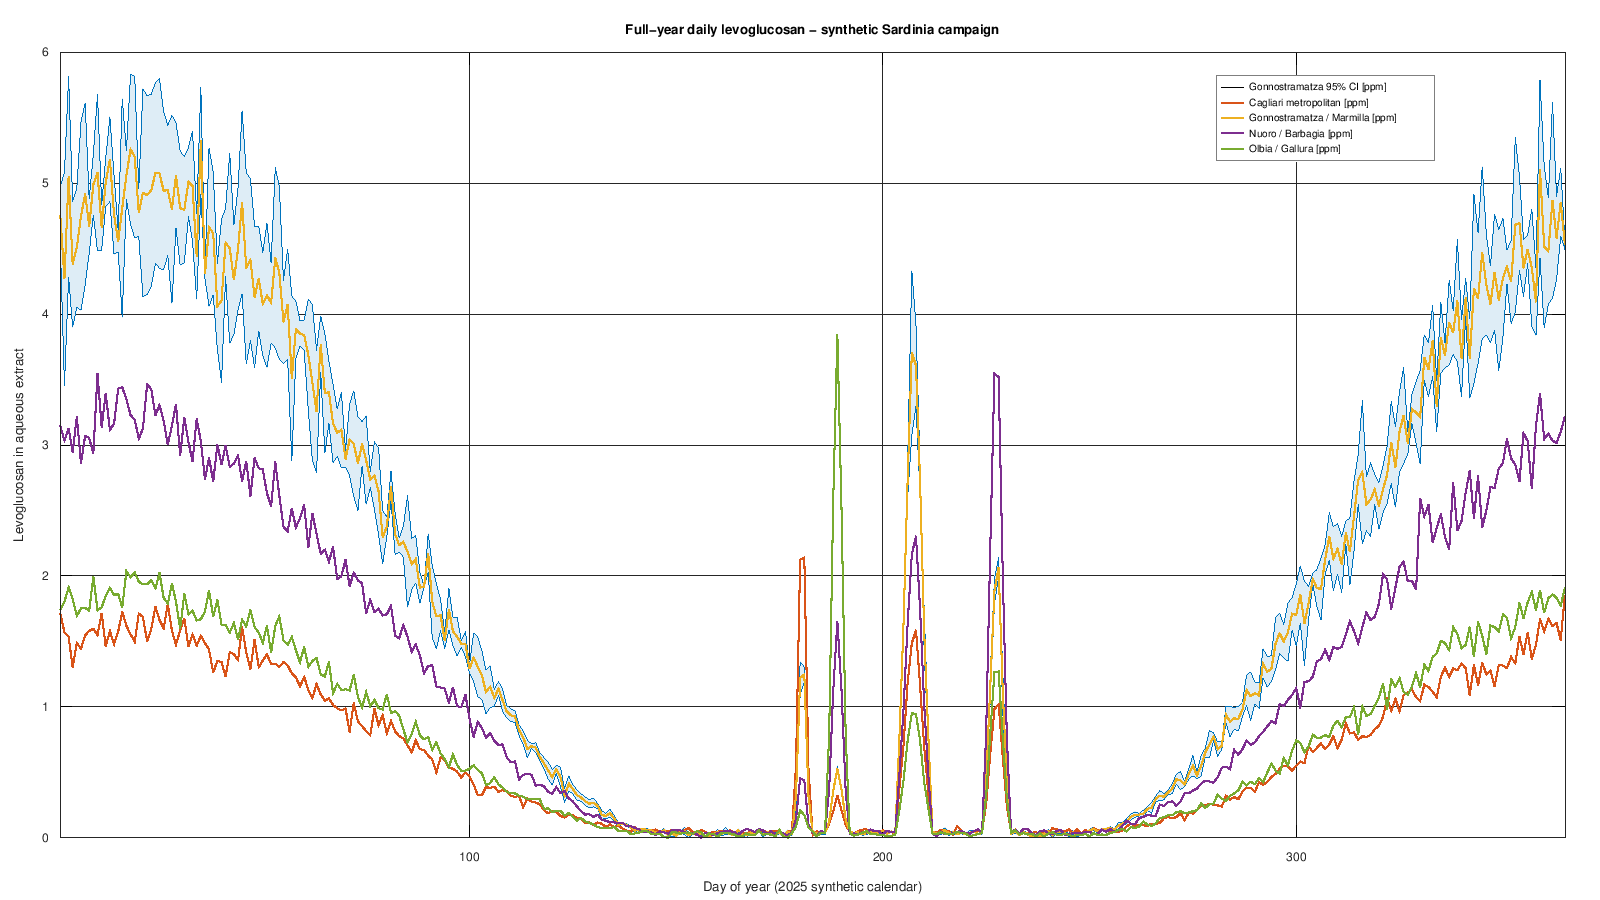
Full-year daily levoglucosan — real GX-TXT render produced by the Session. -
02_monthly_errorbars.png
Monthly means with true 95% CI variables used as error bars.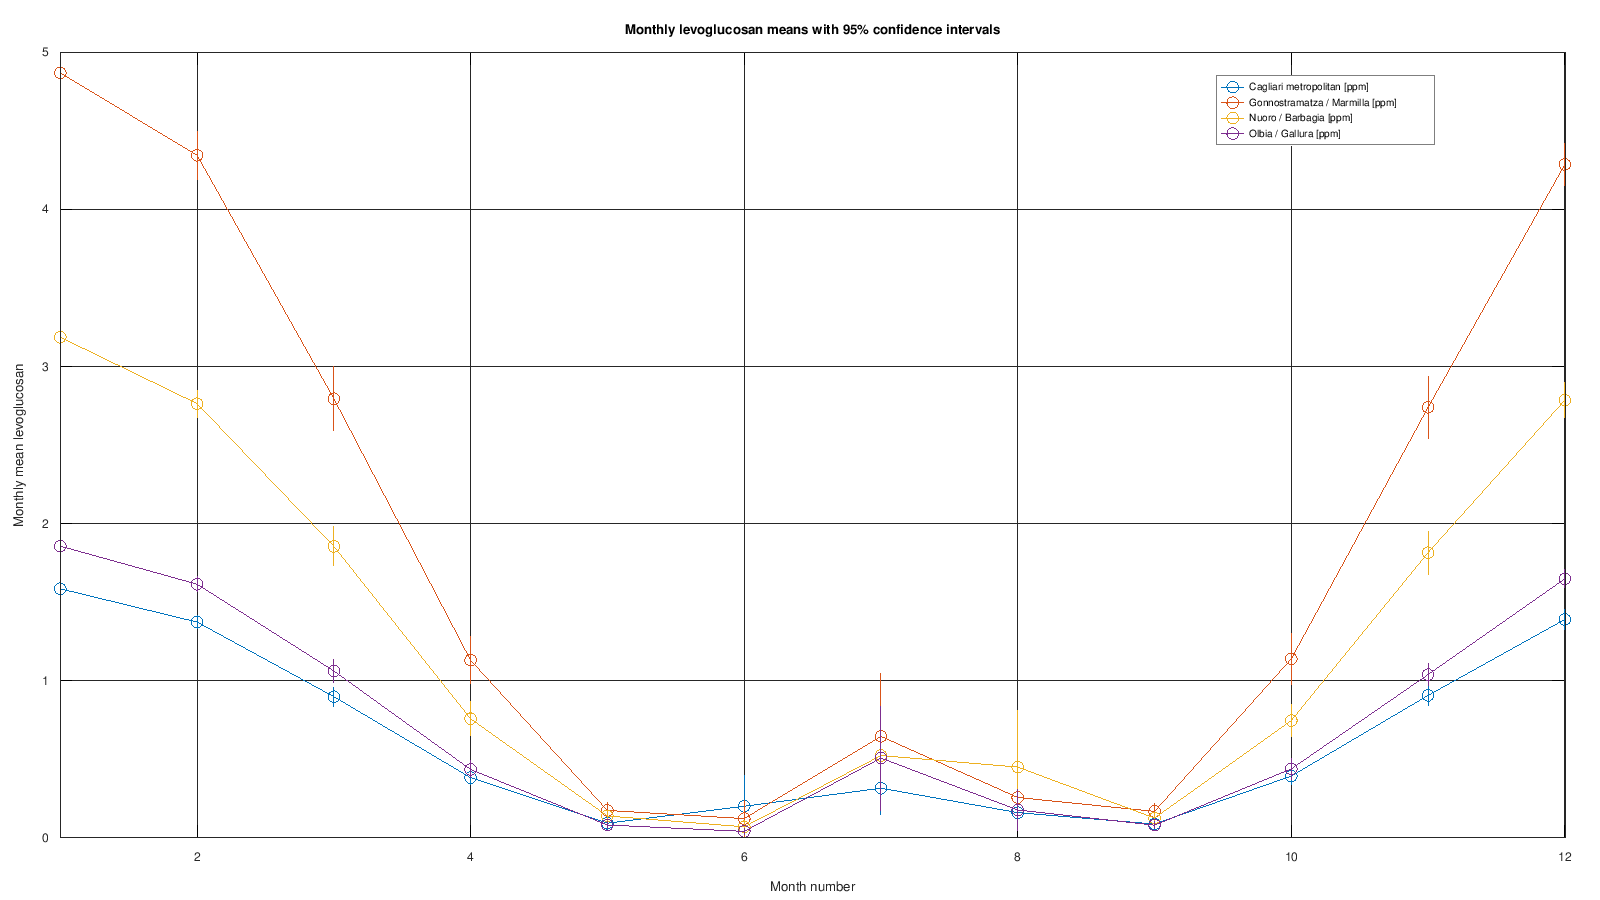
Monthly means with 95% confidence intervals — real GX-TXT render. -
04_seasonal_site_comparison.png
Site comparison across winter, spring, summer non-fire, summer fire and autumn categories.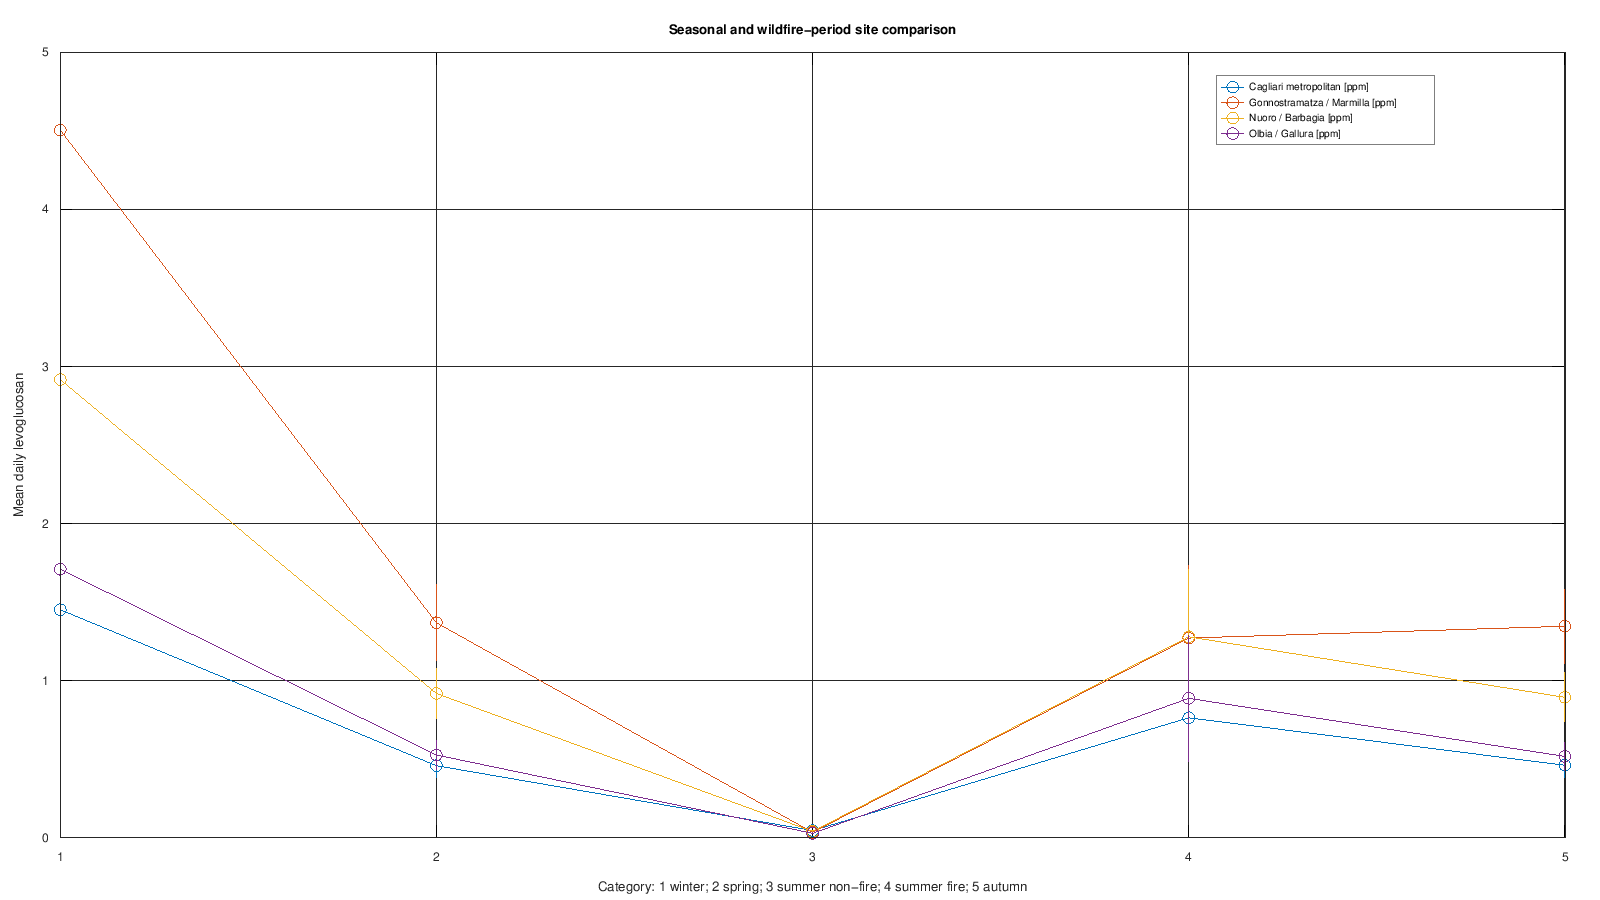
Seasonal comparison across monitoring sites — real GX-TXT render.
14.2 Wildfire group
-
03_selected_wildfire.png
Detailed strongest synthetic fire interval with daily mean and 95% CI plus event-region annotation.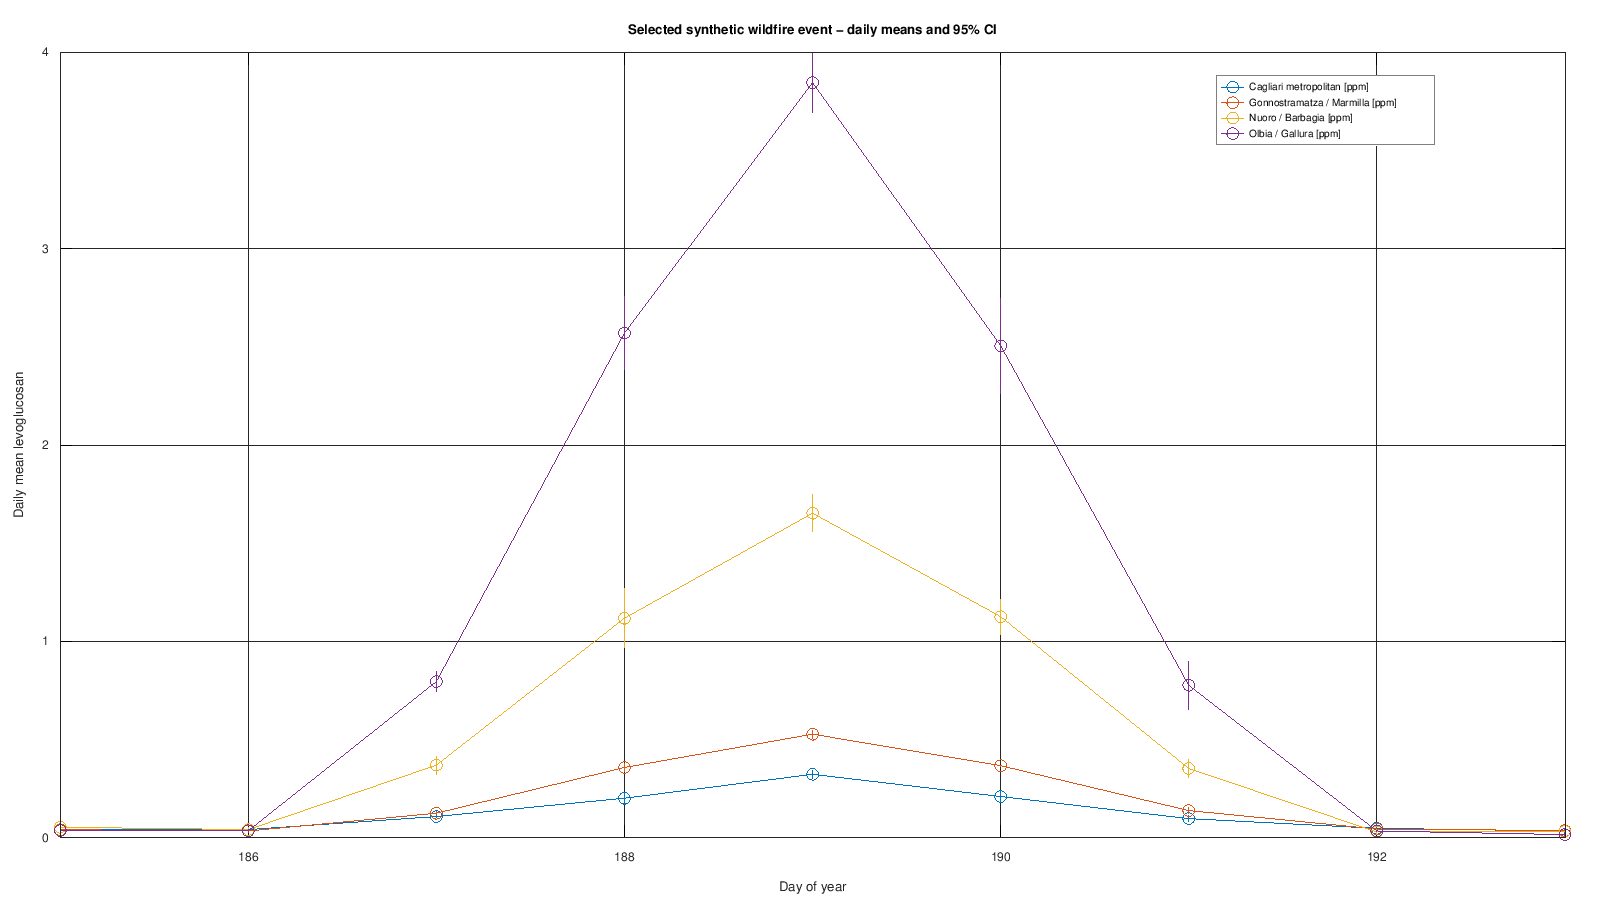
Selected wildfire episode with event annotation — real GX-TXT render. -
05_fire_exposure_relationship.png
Daily mean concentration versus fire exposure index, together with the derived fit.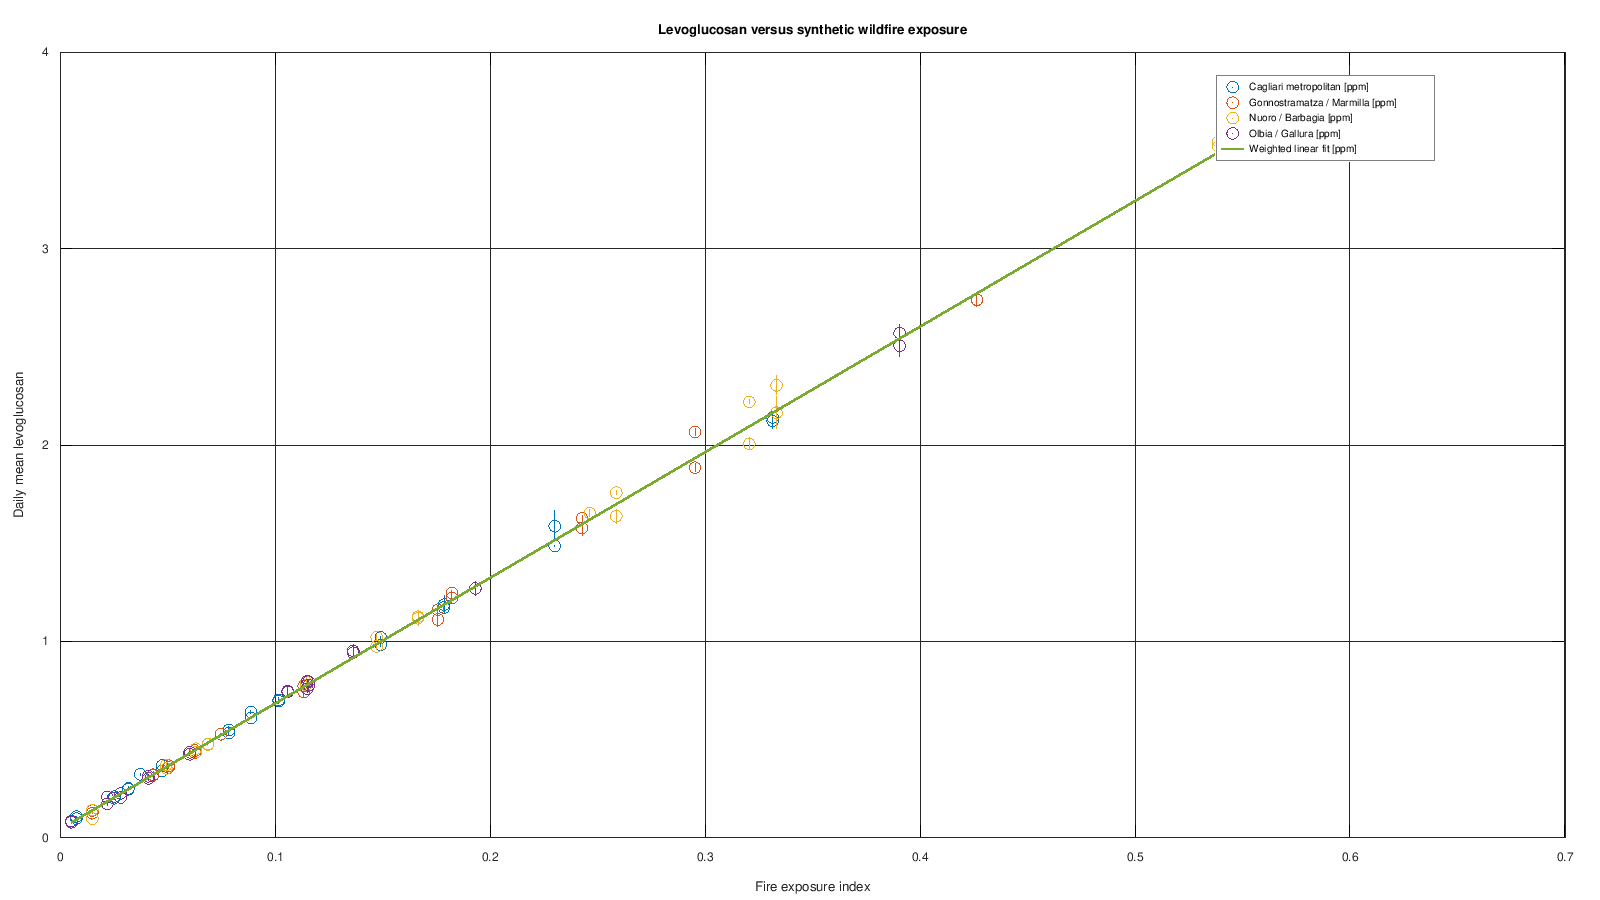
Fire-exposure relationship and fitted trend — real GX-TXT render. -
06_fire_distance_relationship.png
Fire-affected daily concentration versus active-fire distance.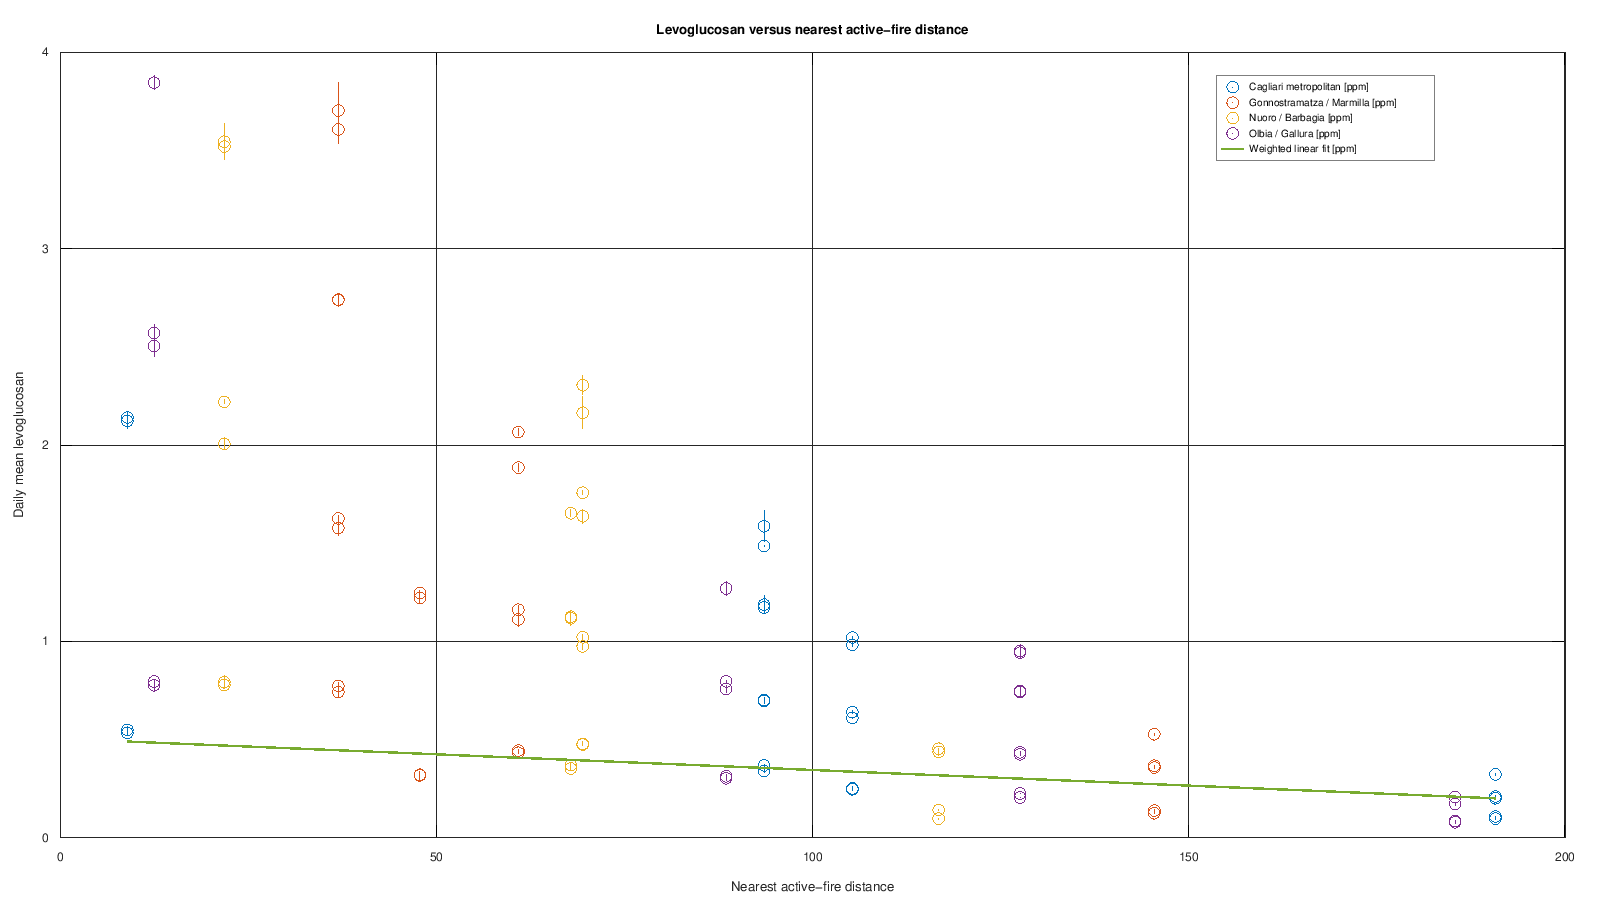
Concentration versus active-fire distance — real GX-TXT render.
14.3 Spatial group
-
07_geographic_site_comparison.png
Compact four-site geographical comparison. It is descriptive and does not treat four sites as a dense spatial survey.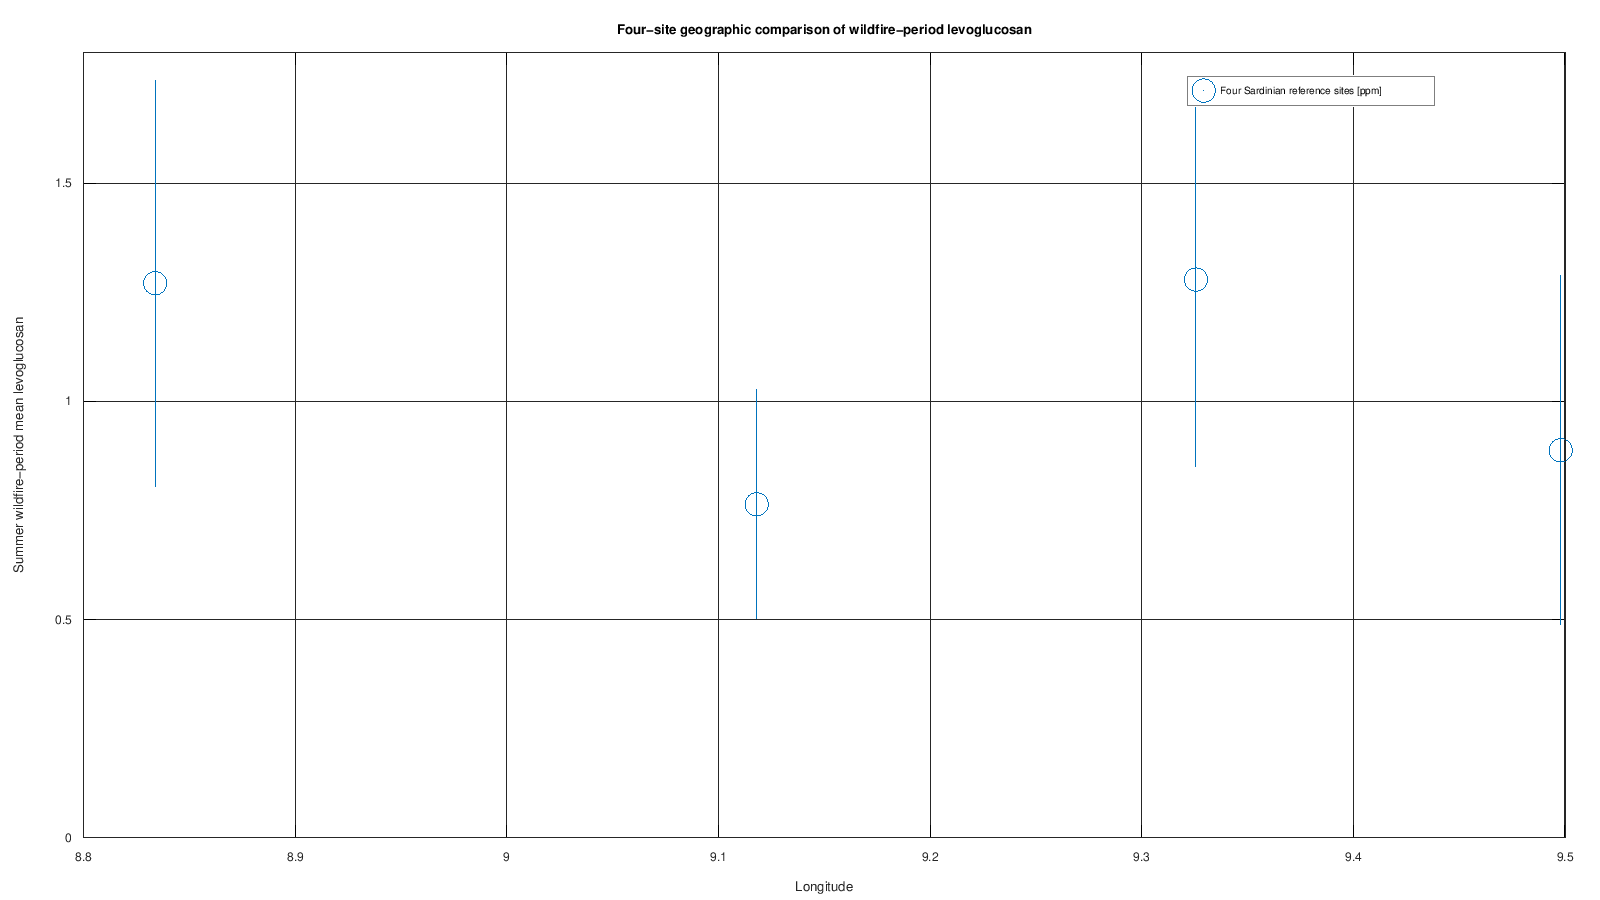
Four-site geographical comparison — real GX-TXT render. The sparse set of sites is descriptive, not a continuous spatial survey.
14.4 Uncertainty/QC group
-
08_measurement_uncertainty.png
Raw technical triplicates, daily triplicate mean and 95% CI over a representative period.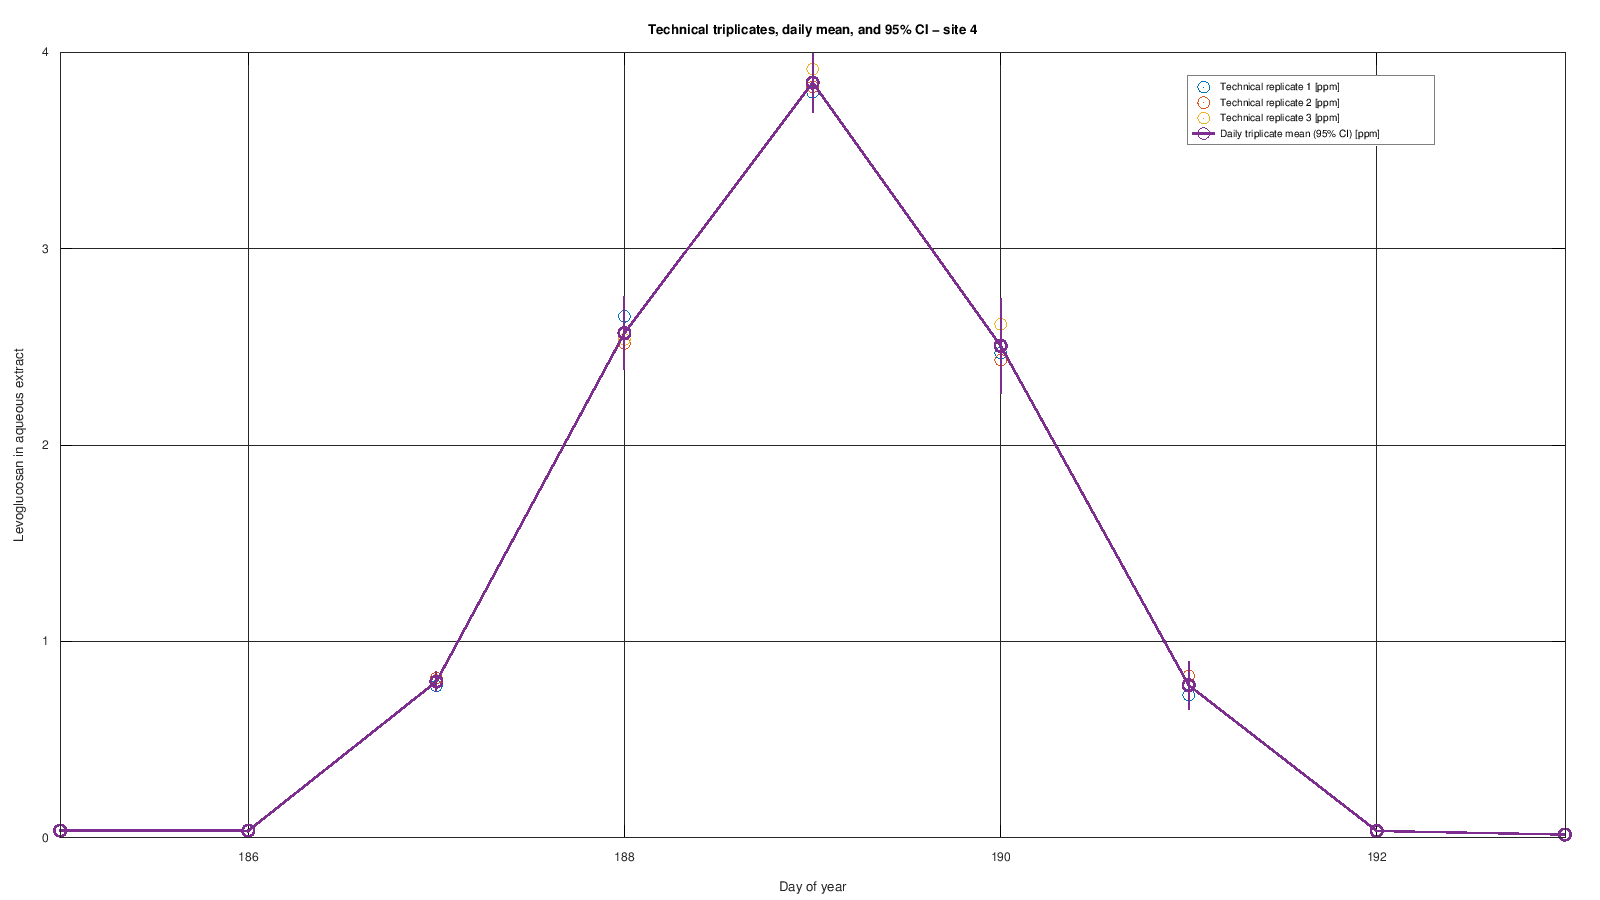
Measurement uncertainty from technical triplicates — real GX-TXT render. -
09_measurement_qc_cv.png
Daily technical-replicate CV% for all sites plus the configured QC threshold.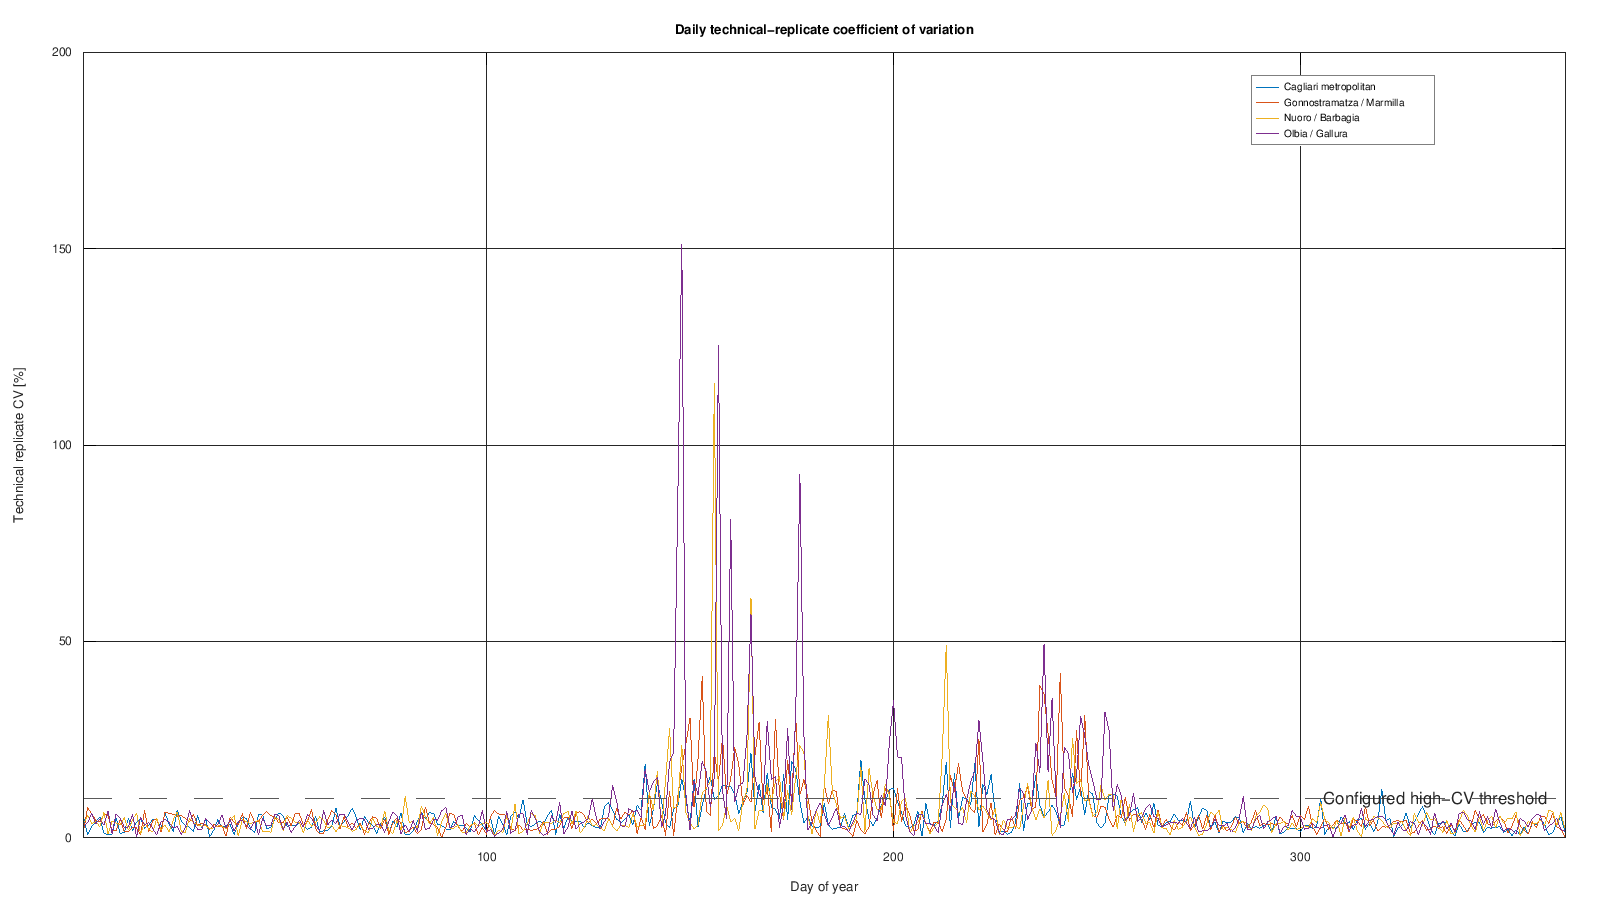
Daily replicate CV% and configured QC threshold — real GX-TXT render.
14.5 Cross-site group
-
10_cross_site_correlations.png
Six synchronized same-day pairwise Pearson correlations.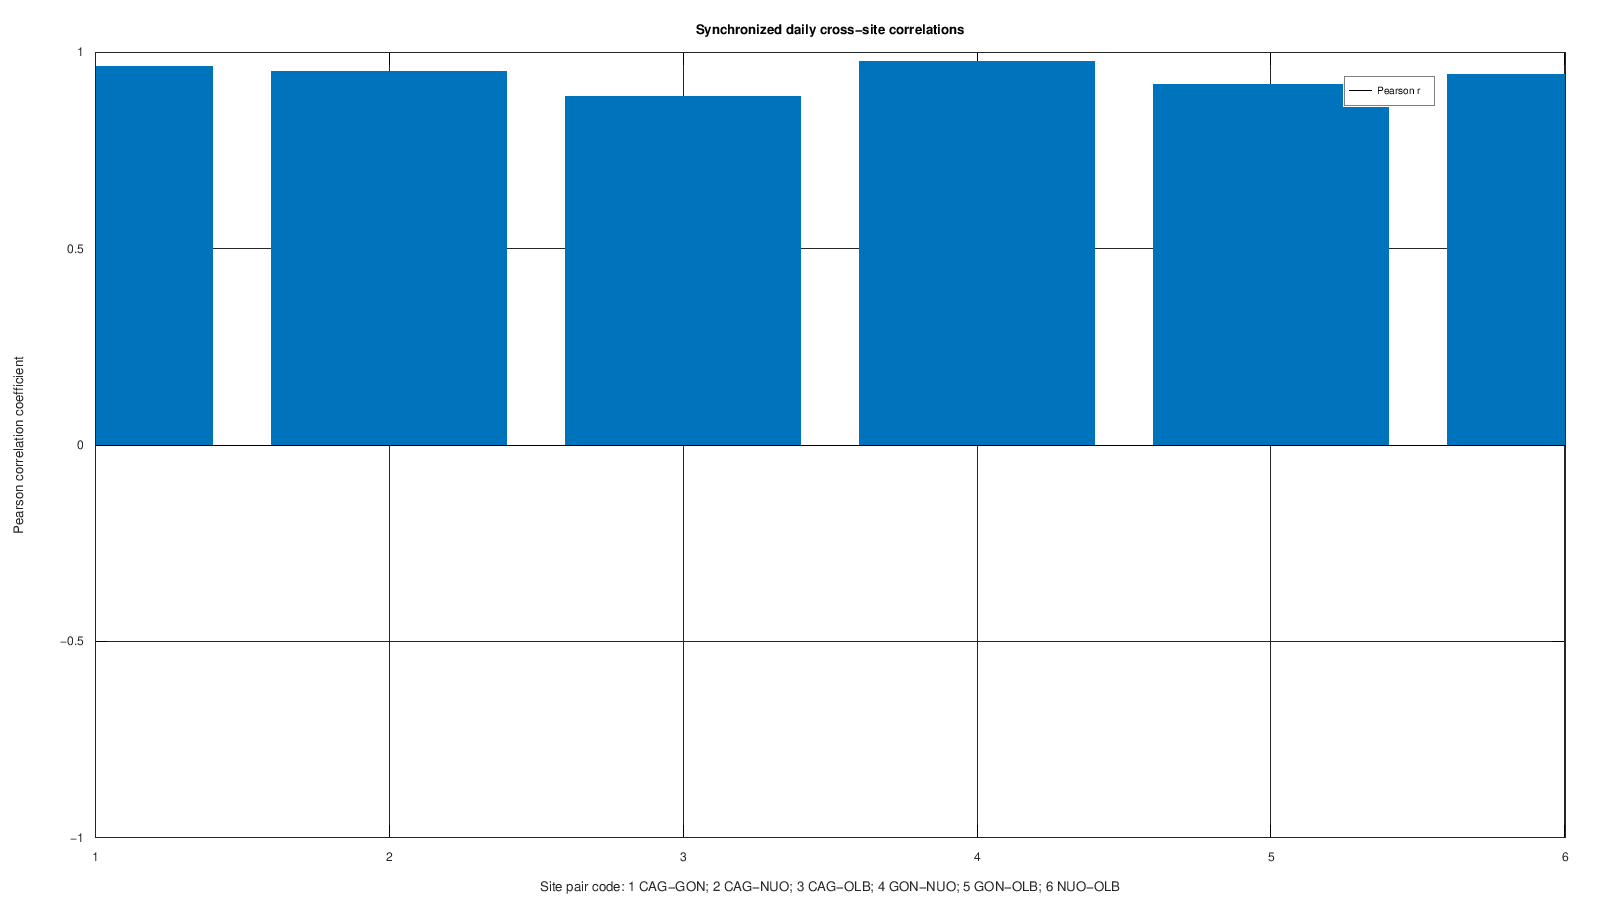
Same-day cross-site Pearson correlations — real GX-TXT render.
14.6 Anomaly group
-
11_anomaly_scores.png
Per-site robust positive anomaly scores with configured threshold.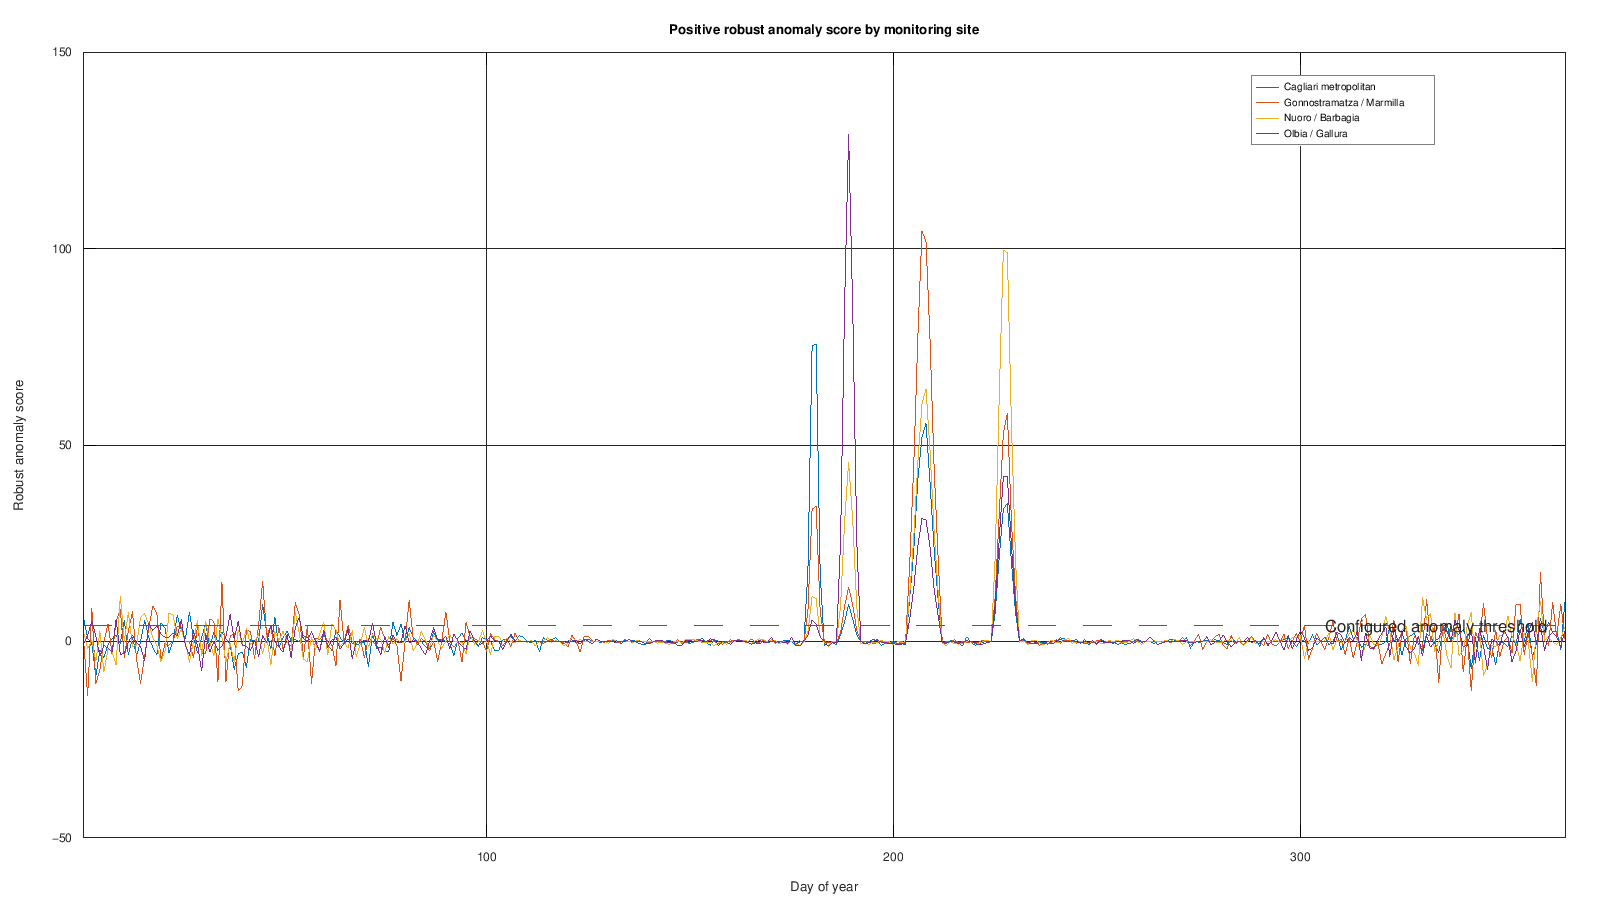
Robust positive anomaly scores and threshold — real GX-TXT render.
14.7 Campaign summary group
-
12_campaign_site_summary.png
Annual mean concentration by site with annual CI.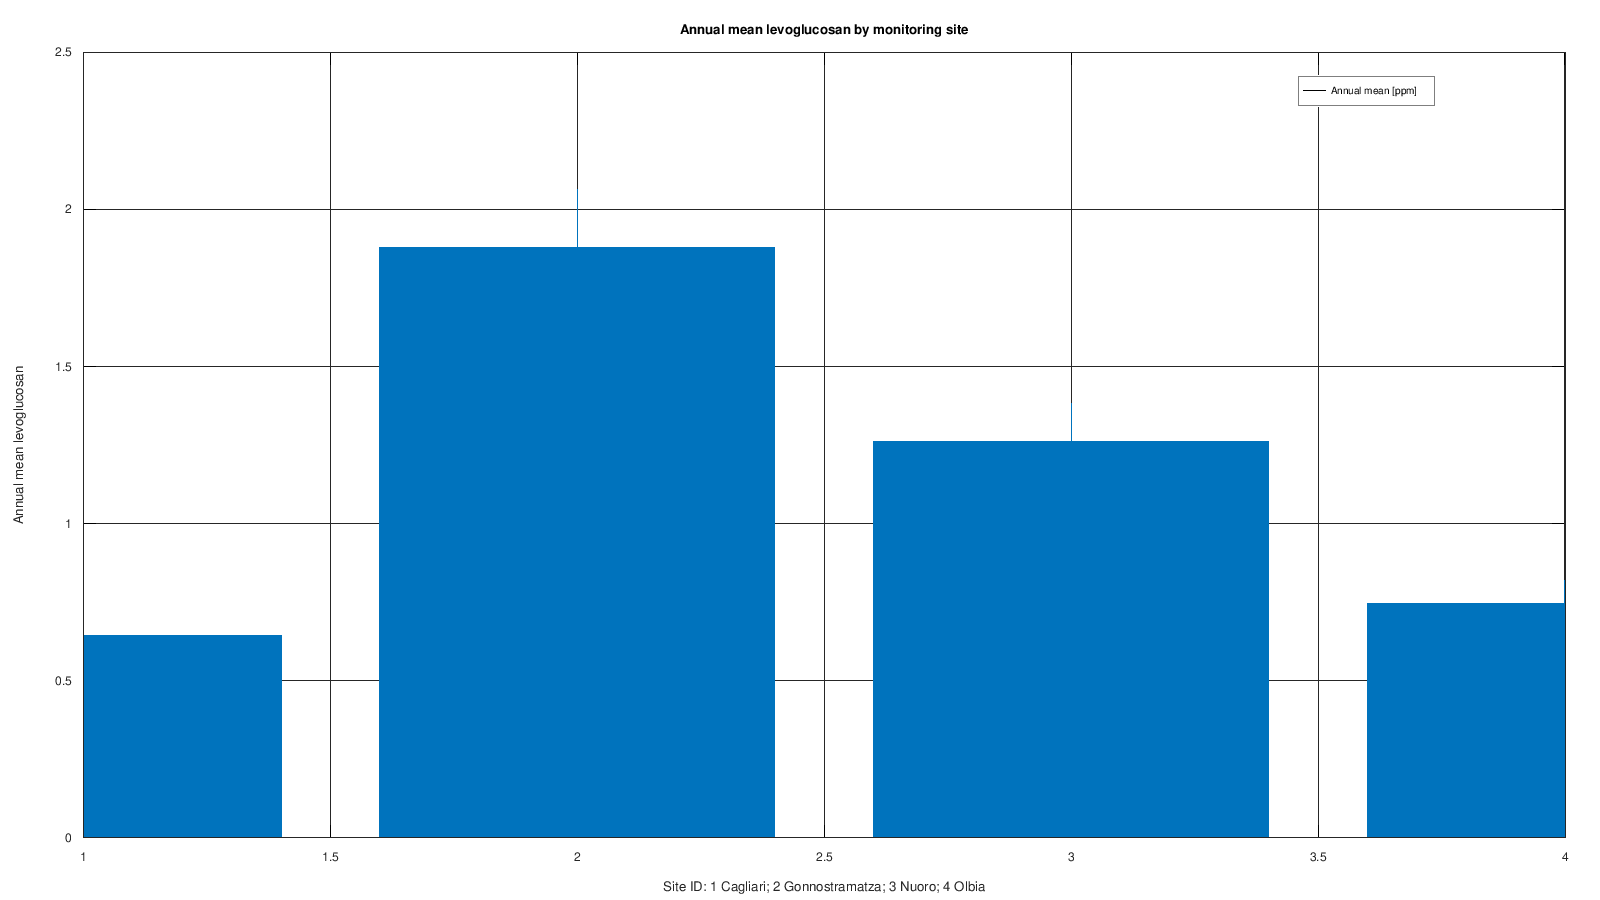
Annual campaign summary by site — real GX-TXT render.
The file automatic_graphs.ini records only the graphs
actually rendered in the current run.
15. Optional 3D spatial views
Both spatial views use persistent public
plot.dataset.xyz Plot Variants. Their viewpoint, axes,
colors and exports are editable through the shared plot window. The
topographic view labels sites by ID in its legend; the report maps site
IDs to names.
15.1 Topographic site view
13_spatial_3d_topography.png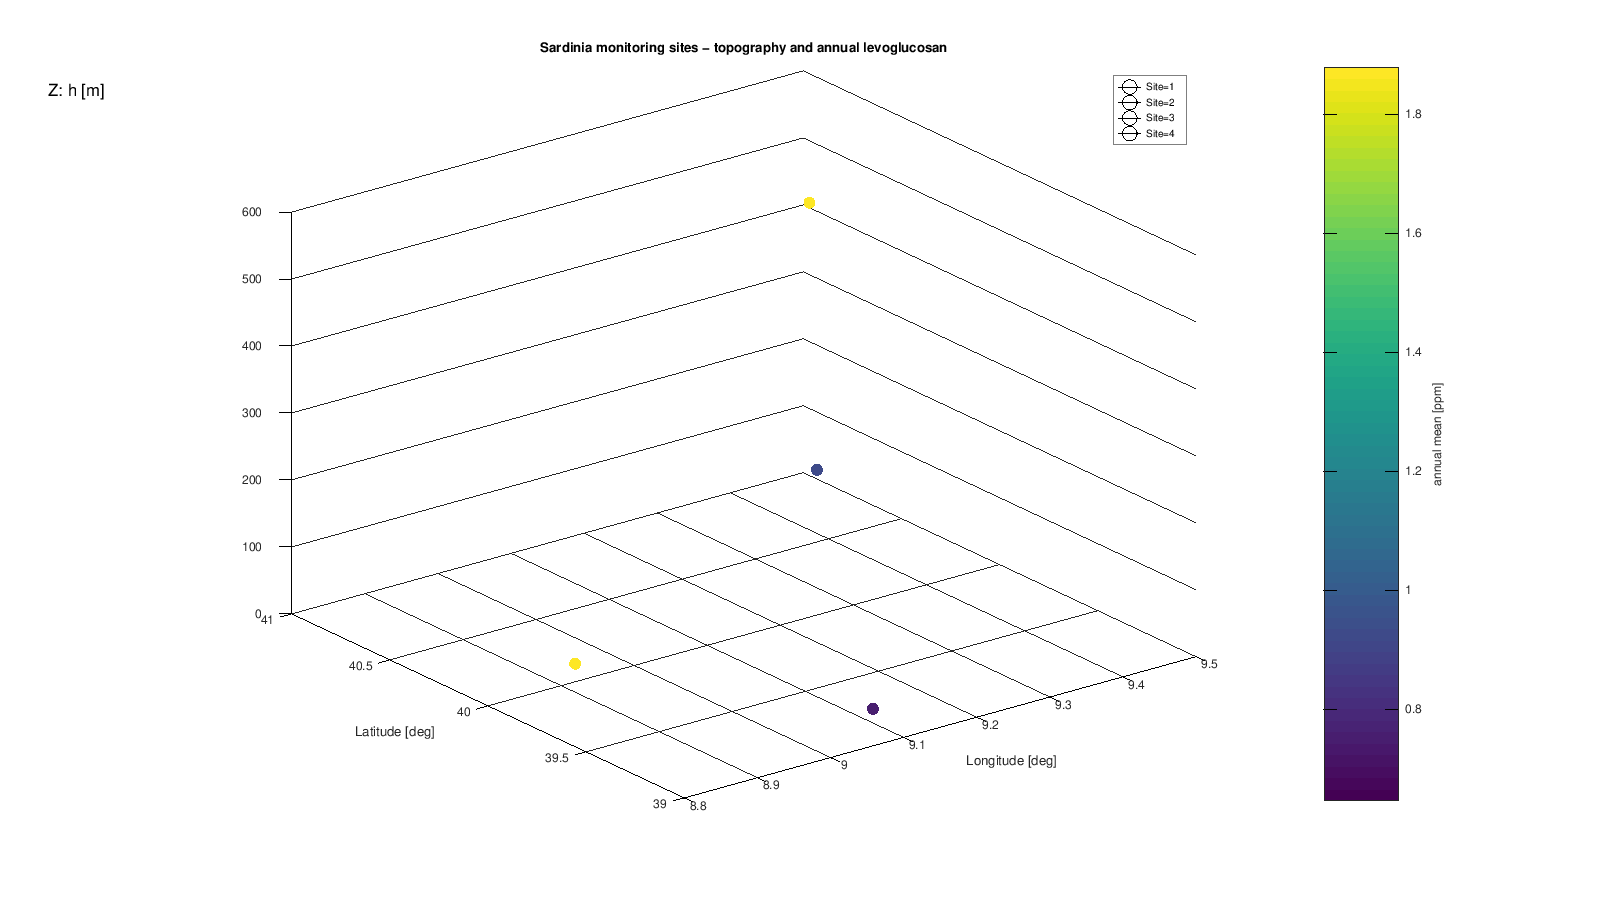
Geometry:
X = longitude [deg]
Y = latitude [deg]
Z = elevation [m]
Color:
annual mean levoglucosan [ppm]This graph uses the actual coordinates/elevation carried by the generated Dataset.
15.2 Wildfire-response triangulated view
14_spatial_3d_fire_surface.png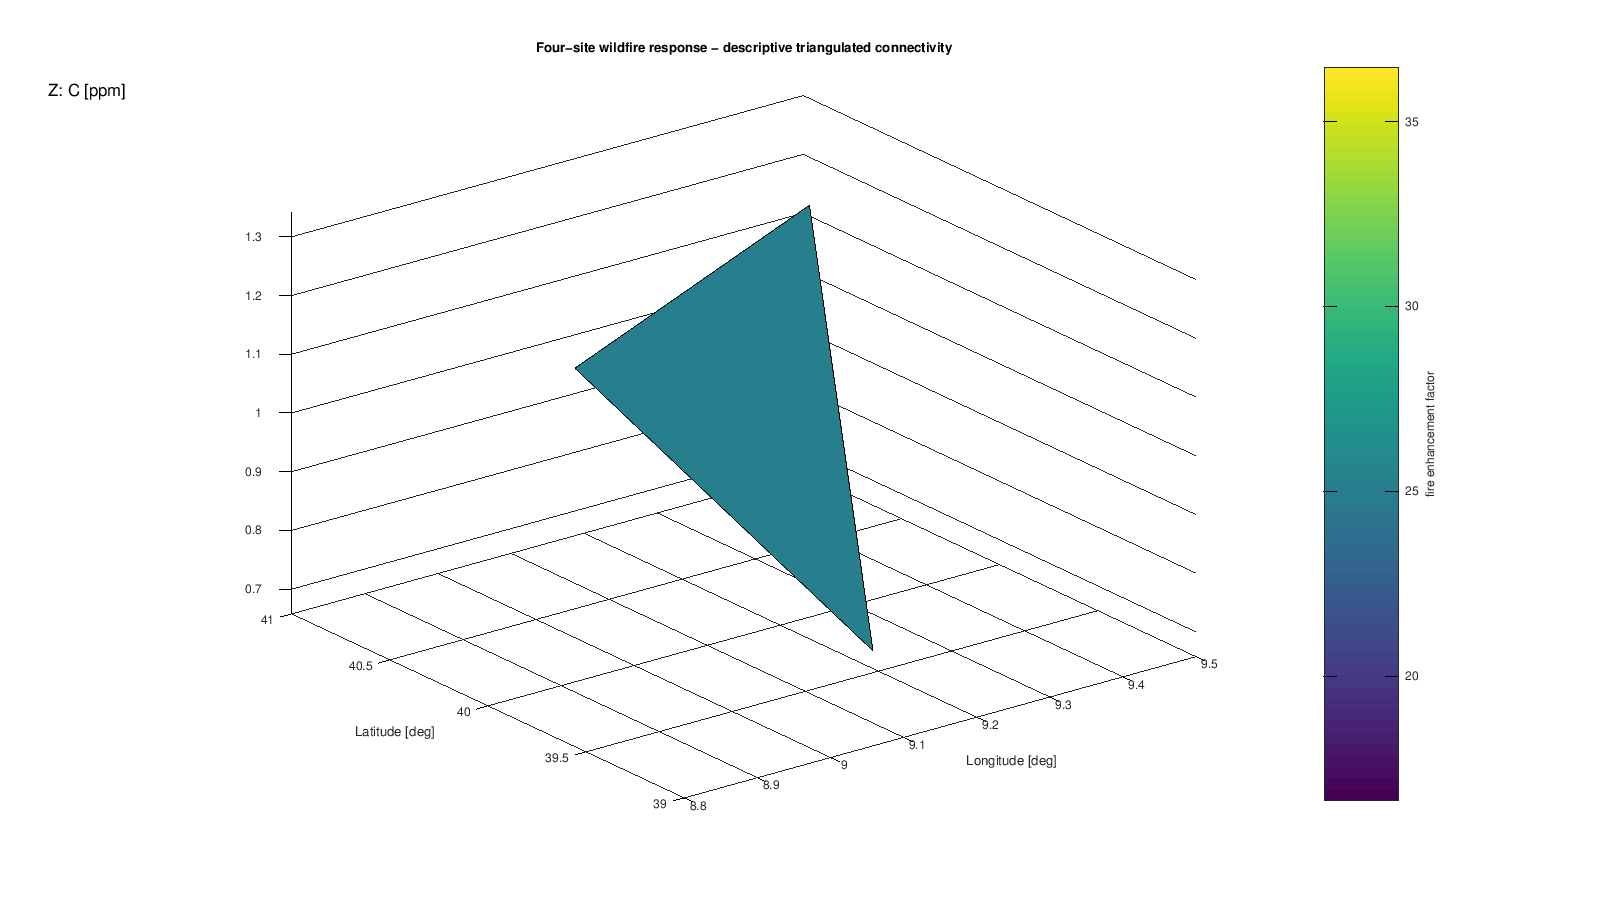
Geometry:
X = longitude [deg]
Y = latitude [deg]
Z = summer wildfire-period mean levoglucosan [ppm]
Color:
wildfire enhancement factorThe public Plot.dataset triangulated renderer may construct Delaunay connectivity from the four site coordinates. The triangles are visualization topology only. No values are interpolated onto a regular geographic grid and the graph must not be interpreted as a continuous concentration map of Sardinia.
With only four sites, the 3D views are demonstrations of coordinate/elevation-aware scientific visualization, not spatial-statistical surfaces.
16. Text and machine-readable outputs
16.1 Scientific report
levoglucosan_campaign_report.txtThe report describes the enabled analysis groups and calculated values, including relevant site, seasonal, wildfire, QC, correlation and anomaly results.
16.2 Metrics
levoglucosan_campaign_metrics.iniContains machine-readable campaign metrics, configuration parameters and output-group state.
16.3 2D graph manifest
automatic_graphs.iniRecords rendered plot.dataset graph variants and copied
PNG artifacts. If 2D graph rendering is disabled, it is still produced
with count=0.
16.4 Analysis output manifest
analysis_outputs.iniRecords enabled groups, 2D/3D rendering state and generated 3D sidecar filenames.
17. Performance note
The scientific source contains only 4,380 replicate rows and is small for numerical computation.
The most expensive part of a full run can be graphics, especially
when all twelve plot.dataset variants plus two 3D PNGs are
enabled. The current GX-TXT plotting path may spend appreciable CPU time
in Tcl preparation/render orchestration for complex non-binary graph
data.
To separate numerical analysis from rendering, disable:
render_2d_graphs
render_3d_graphs
or enable only the scientific output groups required for the current demonstration.
The plugin does not perform private down-sampling or alter scientific Datasets to hide framework plotting cost.
18. Reproducibility
Generator configuration:
generator version = 1.1.1
seed              = 20250923
calendar year      = 2025
Generator 1.1.1 changes ready-to-run binding metadata only. The synthetic campaign model and deterministic seed remain the same as generator 1.1.0.
Repeated generation with the same generator version and parameters produces deterministic scientific files.
19. Scientific background and literature basis
19.1 Levoglucosan and Sardinian seasonality
Atzei et al. studied PM2.5 in Gonnostramatza, Sardinia, using
levoglucosan as a biomass-burning tracer. The reported winter/summer
contrast is large: approximately 2096 ± 324 ng/m3 in winter
and 18 ± 7 ng/m3 in summer at that real study site.
This demonstration uses that result only to support the model
structure
high winter residential biomass-burning signal + low ordinary summer background.
It does not copy those measurements into the generated Dataset.
Reference:
- Atzei D., Fermo P., Vecchi R., Fantauzzi M., Comite V., Valli G.,
Cocco F., Rossi A. Composition and origin of PM2.5 in Mediterranean
Countryside. Environmental Pollution 246 (2019) 294-302. DOI
10.1016/j.envpol.2018.12.012.
19.2 HPAEC-PAD repeatability and detection performance
Caseiro et al. describe aqueous aerosol-filter extraction followed by HPAEC-PAD determination of saccharides including levoglucosan, with repeatability on the order of a few percent RSD and solution detection limits in the hundredths of µg/mL range for individual sugars under that method.
- Caseiro A. et al. Determination of saccharides in atmospheric
aerosol using anion-exchange high-performance liquid chromatography and
pulsed-amperometric detection. Journal of Chromatography A 1171
(2007) 37-45. DOI
10.1016/j.chroma.2007.09.038.
Piazzalunga et al. report a simplified HPAEC-PAD levoglucosan method with approximately 4.8% RSD repeatability and lower solution detection limits under their specific setup.
- Piazzalunga A. et al. A simplified method for levoglucosan
quantification in wintertime atmospheric particulate matter by high
performance anion-exchange chromatography coupled with pulsed
amperometric detection. International Journal of Environmental
Analytical Chemistry 90(12) (2010) 934-947. DOI
10.1080/03067310903023619.
The generator therefore uses a simple literature-plausible synthetic analytical model rather than reproducing any one published method exactly.
19.3 Montiferru wildfire inspiration
ISPRA reported that the historical Montiferru fire began on 24 July 2021 and affected a very large area. The synthetic Central-West event uses only the broad scale and late-July character as inspiration. Event coordinates, 2025 dates and concentration response are generated values.
Reference:
- ISPRA, ISPRA a supporto del Dipartimento della Protezione Civile per il monitoraggio dell’incendio scoppiato nell’area del Montiferru nell’Oristanese, 2021.
19.4 Geographic reference
The Regione Autonoma della Sardegna Geoportale was used during development as a reference for locality/geographic convention. Generated locations remain synthetic monitoring reference points, not official stations.
20. Interpretation limits
This demonstration is intentionally broad, but it has strict scientific limits:
- all generated measurements are synthetic;
- four sites do not constitute a dense spatial survey;
- 3D triangulation is not spatial interpolation;
- correlation does not independently establish causation;
- the anomaly detector identifies unusual positive departures, not emission sources;
- one biomass-burning marker is not sufficient for quantitative source apportionment;
- the QC CV threshold is configurable demonstration logic, not a universal laboratory acceptance criterion;
- synthetic truth is reserved for generator/test validation and is not used by normal analysis.
21. Public GX-TXT APIs used
The package uses established public framework services rather than adding a private scientific subsystem. Derived tables are published through Dataset Publication API v2.
MODULE_API_v1
ANALYSIS_SOURCE_MAP_API_v1
ANALYSIS_SOURCE_METADATA_RUNTIME_v1
TABLE_STREAM_API_v3
DATASET_PUBLICATION_API_v2
NUMERIC_API_v1
PLOT_DATASET_API_v2
PLUGIN_INSTALL_API_v1
SESSION_GENERATOR_LIBRARY_API_v1
DOCUMENTATION_API_v1
The normal data path uses Table Stream with
numeric_transport=auto. Generic numerical operations such
as regression and moving-median smoothing are delegated to
math.numeric / NUMERIC_API_v1.
22. Validation
The package includes focused tests for:
- deterministic generator structure and scientific behavior;
- ready-to-run Session generation through framework APIs;
- stable binding agreement between module descriptor, generator and Octave runtime;
- package metadata and public API use;
- installation/uninstallation through Plugin Install API v1;
- all twelve 2D PlotSpecs against the real
PLOT_DATASET_API_v2validator; - output-group graph filtering;
- retained Tcl global-scope framework-source behavior in the graph helper.
The packaging environment used for version 1.2.0 does not contain GNU
Octave. Therefore real Octave numerical execution and real 3D PNG
rendering cannot be claimed as packaging-environment PASS results. Those
checks must be performed on the target GX-TXT server with GNU Octave
installed. See TEST_RESULTS.md for the exact executed
checks.
23. Recommended demonstration modes
Full demonstration
Leave every output enabled. This produces the largest collection of scientific outputs and graphs.
Numerical/report-only demonstration
Disable:
render_2d_graphs
render_3d_graphs
All derived Datasets and text/metrics outputs are still produced.
Fire-focused demonstration
Enable wildfire analysis and optionally spatial analysis; disable unrelated presentation groups.
Laboratory uncertainty/QC demonstration
Enable measurement uncertainty/QC and disable the other presentation groups.
3D-only graphics experiment
Enable spatial analysis and render_3d_graphs, disable
render_2d_graphs. The numerical derived Datasets remain
available, but only the two 3D PNG sidecars are rendered.
24. Package contents
The independently installable plugin package contains:
plugin-package.ini
module.ini
README.md
MANUAL.md
CHANGELOG.md
TEST_RESULTS.md
LICENSE
runtime/
tests/
session_generators/
Install the plugin through the normal GX-TXT Plugin Install API / user interface. Do not copy files into CORE manually.